Blogs

Why Choose a Solar Power System?

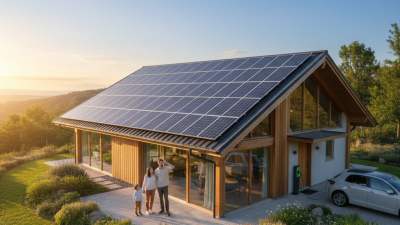
A solar power system turns sunlight into usable electricity through rooftop or ground-mounted panels and an inverter. For many households, it can reduce the amount of power purchased from the grid. The benefit is easy to picture: on a bright afternoon, panels generate electricity while appliances are running at home. Some systems can also pair with a battery, storing energy for later use. That can help during outages, though backup depends on system design and battery capacity.

The right choice depends on more than sunshine. Roof direction, shading from trees, local weather, electricity rates, and household usage all affect how much value a system may provide. A careful assessment should include recent utility bills, an inspection of the roof, and clear estimates for equipment, installation, and expected production. Ask installers how they calculate savings and what warranties cover. Compare the assumptions, not just the headline price.

Solar is not a magic switch. Not everywhere. Upfront costs can be substantial, and a shaded roof or low electricity use may weaken the financial case. Even a well-designed system will produce less on cloudy days and little at night; grid access or storage may still matter. These limits deserve an honest look. With realistic estimates and qualified installation, solar can offer cleaner electricity, more control over energy costs, and a practical long-term upgrade for a suitable property.

Why Choose a Solar Power System?

How Solar PV Works: Global Capacity Reached 1,419 GW in 2023 (IRENA)

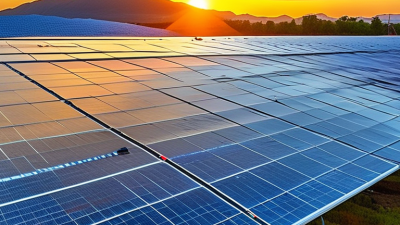
Solar photovoltaic (PV) panels turn sunlight into electricity through semiconductor cells. When light reaches a cell, it releases electrons and creates direct current. An inverter converts that current into alternating current for household appliances. The process is quiet, with no fuel burned on your roof. It is simple in principle, but actual output depends on sunlight, temperature, shading, and system design.

IRENA reported that global solar PV capacity reached 1,419 GW in 2023. That figure reflects worldwide installed capacity, not the electricity available at every home. A shaded roof in winter will produce less than a clear, sunlit one. Panels can still generate power on cloudy days, though output usually falls. Capacity figures also do not explain storage, grid access, or local energy use. Those details matter when judging what a solar system can do. The numbers are impressive, but they do not answer every practical question.

Tips: Check your roof’s sun exposure throughout the day, not just at noon. Ask for an estimate based on local weather and your past electricity use. Compare expected production with your needs. Estimates can miss things. A nearby tree may grow, or shade a roof later in the day.

Which System Parts Matter: Modules, Inverters, Batteries, and Grid Connections

Solar power works best when its parts are planned as one system. Modules turn sunlight into direct-current electricity, but their output depends on roof direction, tilt, and shade. A chimney shadow can reduce production more than expected. Even a small roof may need a careful layout.

The inverter converts that electricity into the form most household equipment can use. Its capacity should suit the modules and expected loads, rather than simply match a round number. Batteries store surplus energy for evening use or outages, but they add cost and need suitable ventilation and temperature conditions. More storage is not always better. A battery chosen without reviewing actual evening demand may sit partly unused.

Grid connections let a home draw power when solar production falls and, where arrangements allow, send excess electricity outward. Connection equipment and utility requirements should be checked before installation; assumptions can delay a project. Design is rarely neat. A spreadsheet may overlook seasonal shade or a family’s changing habits, so real bills and roof observations matter. There is no perfect layout. Review the trade-offs before deciding which component deserves the larger share of the budget.

How Solar Cuts Costs: Utility PV LCOE Fell 89% from 2010 to 2022 (IRENA)

Why Choose a Solar Power System?

How Solar Cuts Costs: Utility PV LCOE Fell 89% from 2010 to 2022 (IRENA)

IRENA reports that the global weighted-average levelized cost of electricity (LCOE) for utility-scale solar PV fell 89% between 2010 and 2022. LCOE estimates the cost of generating electricity over a project’s lifetime. The decline reflects cheaper modules, improved project design, and more efficient construction. It is a striking change.

For households, this trend matters, but it does not promise an 89% reduction in an electricity bill. Utility-scale plants differ from rooftop systems, and local equipment, labor, financing, and installation costs vary. A sunny roof may produce useful power, yet shading from a chimney can change the numbers. Details count.

A practical comparison starts with your recent bills, roof condition, and expected system output. Ask how the estimate handles maintenance, inverter replacement, and seasonal production. Check the assumptions. LCOE is a useful measure, not a personal quote, and retail electricity prices may not move in step with generation costs. One estimate may look precise while hiding uncertainty; that deserves a closer look.

Why Choose a Solar Power System? — How Solar Cuts Costs: Utility PV LCOE Fell 89% from 2010 to 2022 (IRENA)

Indicator 2010 2022 Change, 2010–2022
Global weighted-average LCOE of newly commissioned utility-scale solar PV USD 0.445/kWh USD 0.049/kWh Down 89%
Cost reduction per kilowatt-hour — — USD 0.396/kWh lower
2022 LCOE as a share of the 2010 level 100% About 11% About 89% below the 2010 level

LCOE means levelized cost of electricity. Values are global weighted averages for newly commissioned utility-scale solar PV projects, expressed in 2022 U.S. dollars per kilowatt-hour. Source: International Renewable Energy Agency (IRENA), Renewable Power Generation Costs in 2022. Percentage and absolute changes are calculated from the reported figures and rounded.

How Solar Affects Emissions: PV Lifecycle Median Is 48 g CO₂e/kWh (IPCC)

Solar panels generate electricity without burning fuel at the roof, but their climate footprint begins earlier. The IPCC reports a median lifecycle emissions estimate of 48 g CO₂e/kWh for solar photovoltaics. Lifecycle emissions include materials, manufacturing, transport, installation, and end-of-life handling—not only daily operation. This is a median, not a guaranteed result for every system. Details matter.

Actual emissions vary with panel type, manufacturing electricity, system lifespan, sunlight, and maintenance. A panel in a sunny place may deliver more lifetime electricity. That spreads its upfront emissions across more kilowatt-hours. Small details count. Roof orientation, dust, and inverter replacement can change output or service life. Solar is not impact-free; mining and factory energy still leave a footprint. I would be cautious about treating 48 as a personal system’s exact score. It is a useful comparison point, not a household prediction. When comparing solar with grid electricity, use the same lifecycle boundary and local grid data. Then the number becomes more practical, and less like a slogan.

How to Assess a Solar System: Compare Site Yield, Demand, Tariffs, and Payback

Why Choose a Solar Power System?

How to Assess a Solar System: Compare Site Yield, Demand, Tariffs, and Payback

A useful assessment starts with the roof, not a headline savings figure. Check its usable area, direction, pitch, and shade throughout the day. A chimney shadow at 4 p.m. can matter more than it seems. Compare expected annual production with local weather patterns, and ask what assumptions support the estimate. Small differences add up.

Next, compare solar output with your household’s hourly demand. A family using power during sunny afternoons may consume more directly than one whose home is empty until evening. Review a year of electricity bills, including seasonal changes, then check the tariff for both imported and exported electricity. Export rates can be much lower. A larger system is not automatically a better fit.

Estimate payback using the full installed cost, likely bill savings, export income, and any ongoing maintenance. Include equipment performance loss over time, and test more than one electricity-price scenario. Payback is an estimate, not a promise. I would also leave room for uncertainty: household habits change, and forecasts can miss. A spreadsheet may look precise while resting on guesses. Ask for the assumptions in writing, then see whether the result still works if savings are lower than expected.

Why Choose a Solar Power System?

Compare estimated solar yield with household electricity demand to assess how well a system may fit your site.

Illustrative assessment: A 4.5 kW system producing 1,200 kWh per kW annually would generate about 5,400 kWh per year, compared with estimated household demand of 6,000 kWh. At an assumed electricity tariff of $0.25/kWh, export credit of $0.08/kWh, and 70% solar self-consumption, estimated savings are about $1,075 per year. With an installed cost of $9,000, simple payback is approximately 8.4 years. Actual yield, savings, and payback depend on location, shading, usage timing, tariffs, and system costs; this estimate excludes incentives, financing, maintenance, and fixed charges.